The Estimated or Actual Execution Plan provided by SQL Server gives a nice graphical overview, but can be hard to read if you have too many objects and you will also need to point your cursor on each object for further information. There is also an option to extract the Execution Plan in XML, but that requires additonal steps to make it readable. In this tutorial I will show an alternative way with SQL Server Profiler that will provide detailed execution plan information in text form that can be easily reused for further analysis.
Once you've open SQL Server Profiler click on the File tab and then on New Trace.
SQL Server Profiler returns massive information. To narrow down the results and to focus on our main goal, some settings are essential. In the Trace properties click on the Show all events tab and expand the Performance section to capture the Showplan data.
Under Performacnce you will see all types of Showplan information. The one most relevant for our excercise here is Showplan All.
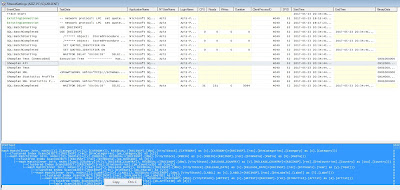
Meanwhile I executed my query from SSMS and SQL Server Profiler immediately returned following records:
Showplan All returns the execution plan and in addition detailed information such as what type of join operator is used, CPU costs, nr of executions etc. Simply mark the relevant text and right click copy.

You can save this info as a txt file or simply paste it in Excel. Once you have it in the right format, the whole thing is very easy to read and you can sort descending by the most expensive objects to lead you straight to the root cause.


